List of Funded Series A Startups (2026)
Series A startups have momentum and funding is fueling their next big leap.
At this stage, these companies have proven product-market fit, built early traction, and now with millions in fresh capital, are focused on scaling fast. Series A startups are hiring aggressively, building out their teams, investing in sales and marketing, and partnering with vendors who can help them grow smarter and faster.
At Fundraise Insider, we track every newly funded Series A startup and deliver verified contact details for their founders, executives, and department heads so you can connect while budgets are being allocated and key decisions are made.
Below is a preview of recently funded Series A startups across the US. Sign-up to start receiving weekly newly funded startup contacts.
While 99% of sales professionals are still grinding through LinkedIn hoping for a 0.7% response rate, you can unlock the holy grail of B2B prospecting: companies with actual money ready to spend. That’s what Fundraise Insider gives you. Not just data, but timing. Not just a list, but an edge.
Sign-up here for the #1 sales prospecting and lead generation tool. And remember, this isn’t a monthly subscription. You pay once to receive a lifetime access to weekly leads.
Newly Funded Series A Startups
Download 10 leads from newly funded startups before signing up for our lifetime deal.
Series A startups leads list includes: First Name, Last Name, Title, Company, Email, Linkedin Url, # Employees, Industry, Website, Company Linkedin Url, Facebook Url, Twitter Url, Company Phone, Technologies, Annual Revenue, Short Description, Founded Year, Top 5 Investors, Funding Amount, Headquarters, Funding Type, Funding Date.
FAQs: Selling to Series A Startups
1. Why should I target Series A startups?
Series A startups have validated their business model and are now focused on scaling. After raising funding, they actively look for external partners to help accelerate product development, streamline operations, improve marketing, and support customer growth. This makes them an ideal audience for B2B service providers.
2. What makes Series A startups different from Seed stage companies?
Unlike Seed stage startups which are still testing their product market fit, Series A startups usually have early traction and revenue. They are looking to grow faster, build stronger teams, and systemize their processes. They have larger budgets and more clearly defined roles, making them easier to sell into.
3. How can I find recently funded Series A startups?
You can subscribe to Fundraise Insider to receive weekly sales leads of Series A startups that have recently raised capital. These updates include verified contact information for decision makers across product, marketing, operations, and leadership.
4. Who should I contact inside Series A companies?
The right contact depends on your offer. Common decision makers include:
- CEO or Co-founder
- COO or Head of Operations
- CTO or Head of Product
- CMO or Growth Lead
- Head of People or Talent Acquisition Manager
5. What are Series A startups focused on after funding?
After a Series A raise, startups typically focus on:
- Hiring across engineering, marketing, and operations
- Expanding customer acquisition and improving retention
- Building scalable systems and automating workflows
- Launching into new markets or verticals
- Meeting compliance and security requirements
6. What types of vendors do Series A startups usually hire?
Series A companies commonly work with vendors in areas like:
- Custom software development and product design
- Search engine optimization and paid advertising
- Customer success tools and onboarding automation
- Sales and marketing enablement platforms
- Recruiting and compliance advisory services
7. When is the best time to contact a Series A startup?
The best time to reach out is within 1 to 2 weeks of their funding announcement. At this stage, they are actively making strategic decisions and allocating budget. Early contact increases your chances of being considered as a trusted vendor from the beginning of their growth journey.
8. What makes selling to Series A startups different from larger companies?
Series A companies move quickly and value speed, flexibility, and measurable results. They often prefer agile vendors who can launch fast, adapt to change, and offer practical solutions. Your pitch should be clear, personalized, and focused on short term outcomes with long term potential.
9. How should I pitch my product or service to a Series A startup?
Your message should highlight results, cost efficiency, and speed of execution. Include social proof if possible. Show that you understand their stage and priorities.
Example: “Congrats on your $7 million Series A. We helped another Series A fintech company reduce onboarding time by 40% in 60 days. I created a short teardown with a few ideas that could help you too. Would you like me to send it over?”
10. Can I get alerts when new Series A startups raise funding?
Yes. Fundraise Insider sends weekly updates with recently funded Series A companies and verified contact information, so you can pitch at the right time with a tailored offer.
Other Funded Startups Data
Series A Startup Funding Statistics and Trends (YTD)
- Total Series A funding rounds: 170
- Mean funding: $24.5 million
- Median funding: $15 million
- 25th percentile: $10 million; 75th percentile: $25 million
- Range: $0 (to 7 rounds) up to $350 million (max)
Monthly Series A Startup Funding Trends for Startups
- January: 46 Series A rounds totaling $1.004 billion
- February: 47 Series A funding rounds totaling $1.449 billion (peak month by both count and total)
- March: 44 Series A rounds totaling $1.089 billion
- April (through 17th): 33 Series A startup funding rounds totaling $0.625 billion
Series A Startups Funded by Round Count
- Information technology & services (84 rounds)
- Research (14)
- Financial services (8)
- Computer & network security (8)
- Hospital & health care (8)
- Series A Startups Funded by Total Funding
- Information technology and services ($1.96 billion)
- Research ($0.846 billion)
- Computer and network security ($0.220 billion)
- Defense and space ($0.167 billion)
- Financial services ($0.135 billion)
Geographic Distribution of Series A Startup Funding Across Top 5 US States
- Series A startup funding in California: 61 rounds, $1.673 billion
- Series A startup funding in Massachusetts: 14, $0.714 billion
- Series A startup funding in New York: 29, $0.450 billion
- Series A startup funding in Texas: 7, $0.441 billion
- Series A startup funding in Washington: 8, $0.145 billion
Series A Startup Funding: Growth Curves Compared Across Top Industries
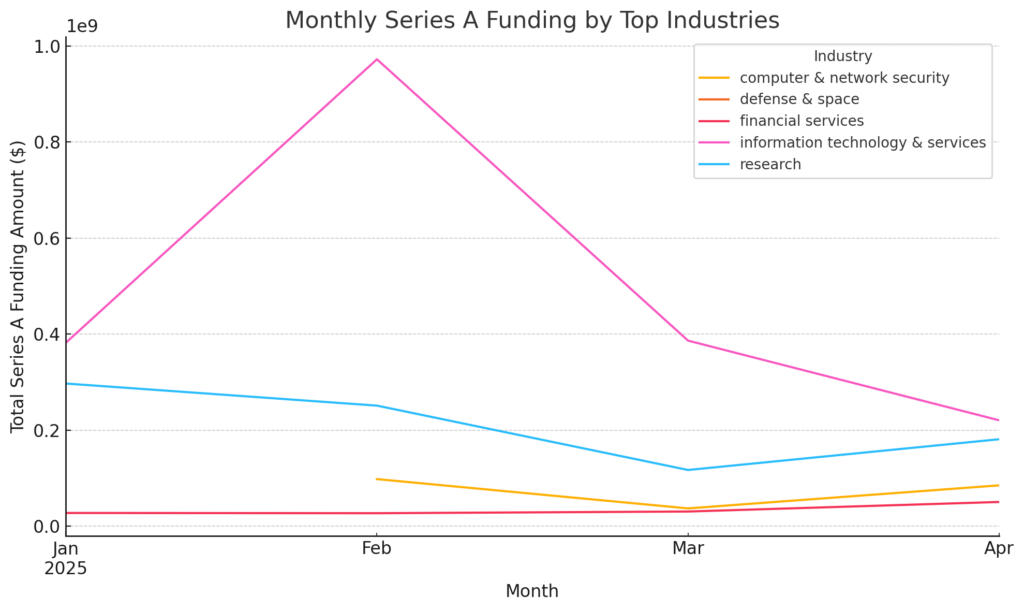
The growth curves for the top five Series A startups industries reveal distinct funding rhythms over Q1 2025:
Information Technology and Services
- Climbs sharply from $390 M in January to $970 M in February, then descends to $220 M by April.
- Indicates a big mid-quarter surge, followed by moderation as the quarter closes.
Research
- Gradual decline from $300 M in January down to $120 M in March, before a modest uptick to $180 M in April.
- Suggests early momentum that cools off but rebounds slightly at quarter’s end.
Computer and Network Security
- Falls from $100 M in February to a low of $30 M in March, then recovers to $85 M in April.
- Reflects lumpy deal flow with both troughs and rebounds.
Financial Services
- Steady, incremental growth from $30 M in January to $50 M in April.
- A reliable, slowly rising corridor of capital deployment.
Defense and Space
- Peaks at $80 M in February, dips to $35 M in March, and rises again to $60 M in April.
- Follows a “peak–valley–recovery” pattern, signaling opportunistic investment windows.
Implications for Series A Startup Deal Strategy:
- Timing is key for IT Services and Defense and Space: focus sourcing efforts just before their mid-quarter peaks.
- Research investors should prepare for early-quarter outreach, then light touch until a slight late push.
- Security deals demand flexible timing, be ready for both quiet and busy weeks.
- Financial Services represents a stable, low-volatility sector; ideal for consistent pipeline development.
Exceptionally Large and Small Series A Startup Funding Rounds
Exceptionally Large Series A Startup Rounds (>$47.5 M)
- Apptronik – $350 M on 2025-02-26
- QuEra Computing – $230 M on 2025-04-11
- Tenvie Therapeutics – $200 M on 2025-01-22
- Merida Biosciences – $121 M on 2025-03-05
- Nexthop AI – $110 M on 2025-01-30
- (Plus 10 more rounds between $48 M and $76 M)
Exceptionally Small Series A Startup Funding Rounds (≤$2.955 M)
- CONTXTFUL Technologies – $1.90 M on 2025-04-15
- Wicked Smart Pad – $2.10 M on 2025-02-20
Key relationship insights for Series A startups
High-Value vs. High-Volume Series A Startup Funding Industries
- Defense and Space and Computer and Network Security top the per-deal averages (>$35 M), though they represent fewer rounds.
- Information Technology and Services leads in volume (84 rounds) with a moderate average deal size (~$22 M).
- Research swings high in both volume and value in Massachusetts (6 rounds at $87 M avg.) but tapers elsewhere.
State-Level Deal Size Leaders
- Massachusetts: Highest average deal (~$24.7 M) across 14 rounds.
- California: Strong volume (61 rounds) with an average of $17.5 M.
- New York and Texas: Mid-tier volume with ~$15 M and $19 M avg, respectively.
Industry-State Clusters for Series A Startups
IT Services:
- California: 38 deals @ $22.2 M avg.
- New York: 13 deals @ $17.7 M avg.
Research:
- Massachusetts: 6 deals @ $87.3 M avg.
- Texas: 1 deal @ $19 M (outlier).
Computer and Network Security:
- Concentrated in CA, NY, IL with avg deal sizes from $10 M–$35 M.
Defense and Space:
- Smaller sample but big checks in CA and MA ($50 M–$80 M).
Financial Services:
- Distributed across NY, CA, FL; avg $15 M–$20 M.
Strategic Takeaways
- Volume-Driven Pipeline: Focus on IT Services in California and New York for a steady flow of mid sized Series A startup funding rounds.
- High-Impact Bets: Target Research and Defense and Space rounds in Massachusetts and California for larger deal sizes.
- Balanced Approach: Blend volume (IT Services) with value (Security, Research) in top states to diversify your portfolio.