List of Funded Pre-Seed Stage Startups (2025)
Funded Pre-Seed startups are where new opportunities are born for sellers, founders, and job seekers alike.
These are the earliest stage companies: backed by angels, accelerators, and early funds, assembling their first teams, choosing their first vendors, and mapping out their future growth.
At Fundraise Insider, we track every newly funded Pre-Seed startup across the United States and deliver verified contact info for founders and their C-suite, giving you the chance to reach out early and become part of their journey – the best sales prospecting leads.
This is where the real relationships (and loyalty) begin.
List of Funded Pre-Seed Startups
👉 Get weekly leads from newly funded Pre-Seed startups
Weekly leads list includes: First Name, Last Name, Title, Company, Email, Linkedin Url, # Employees, Industry, Website, Company Linkedin Url, Facebook Url, Twitter Url, Company Phone, Technologies, Annual Revenue, Short Description, Founded Year, Top 5 Investors, Funding Amount, Headquarters, Funding Type, Funding Date.
Other Funded Startups Data
- Seed startups
- Series A startups
- Series B startups
- Series C startups
- Series D startups
- Series E startups
- Series F startups
- Series G startups
- Hottest AI startups
- Recently funded startups across all funding stages
FAQs: Selling to Pre-Seed Startups
1. Why should I sell to Pre Seed startups?
Pre Seed startups are at the earliest stage of their journey and often operate with lean teams. Once they raise their first capital, they look to work with external partners to help them build faster, launch sooner, and validate their ideas in the market. Selling to them early can position you as a long term partner as they grow.
2. What makes Pre-Seed startups different from Seed or Series A startups?
Pre Seed startups are typically pre-revenue, often pre-product, and are focused on moving from concept to prototype. The founding team is still small, and every dollar counts. They are looking for partners who understand startup challenges and can deliver outcomes quickly and affordably.
3. How can I find recently funded Pre Seed startups?
You can subscribe to Fundraise Insider to receive weekly reports that highlight recently funded Pre-Seed startups. Each report includes verified contact details for founders and key team members so you can pitch with perfect timing.
4. Who should I contact inside Pre Seed companies?
At this stage, the founders are the primary decision makers. Ideal contacts include:
- CEO
- Co-Founder
- CTO if your solution is technical
- Product Lead if they have one in place
5. What are Pre Seed startups focused on after raising funding?
Startups at the Pre Seed stage typically focus on:
- Prototyping and validating their core product idea
- Conducting user research and interviews
- Testing marketing channels and early messaging
- Building pitch decks and investor materials for their next round
- Setting up initial tools and infrastructure for collaboration
6. What types of vendors are Pre Seed startups most likely to hire?
These startups often seek vendors who can help them move quickly with limited resources, such as:
- Freelance developers or low cost development agencies
- Pitch deck designers and brand identity creators
- Market research and validation consultants
- No code and low code platform specialists
- Advisors with startup launch or go to market experience
7. When is the best time to contact Pre Seed startups?
The best time is within 1 to 2 weeks of their funding announcement. That is when founders are assembling their team, outlining product plans, and making initial vendor decisions with fresh capital in hand.
8. How should I approach pricing for Pre Seed clients?
Pre Seed companies operate on small budgets, so transparency and flexibility matter. Offering a small scope, pay as you go, or milestone based pricing model can make your offer more appealing and help build trust early on.
9. How should I pitch my product or service to a Pre Seed startup?
Keep it simple, useful, and focused on helping them get results quickly. Offer to solve one small pain point or deliver a fast win. Include past experience with other early stage startups or show how you understand their specific needs.
Example: “Congrats on the $500k raise. We helped another Pre Seed founder build their MVP in 3 weeks and launch to 100 beta users. I have a few ideas after looking at your concept. Want me to send them over?”
10. Can I get notified when new Pre Seed startups raise funding?
Yes. Fundraise Insider sends weekly updates on Pre-Seed stage startups that just raised capital, complete with contact information so you can start meaningful conversations early in their journey.
Pre-Seed Stage Startup Funding Trends
Total Pre-Seed Rounds: 82 financings between January 6 and April 17, 2025.
Descriptive Statistics of Pre-Seed Startup Funding Amounts:
-
Mean check: $1.52 M
-
Median check: $1.40 M
-
25th percentile: $2.5 K; 75th percentile: $2.0 M
-
Range: $0 (21 rounds) to $10 M
Monthly Pre-Seed Startup Funding Trends:
-
January: 16 rounds, $24.87 M total
-
February: 30 rounds, $49.28 M total
-
March: 23 rounds, $32.24 M total
-
April (to 4/17): 13 rounds, $18.25 M total
Top Industries by Deal Volume:
-
Information Technology & Services: 48 rounds
-
Research: 4
-
Financial Services: 4
-
Hospital & Health Care: 3
-
Internet: 3
Top Industries by Total Pre-Seed Capital:
-
Information Technology & Services: $73.43 M
-
Research: $11.50 M
-
Veterinary: $10.00 M
-
Financial Services: $7.40 M
-
Hospital & Health Care: $4.03 M
Geographic Concentration (Top 5 States):
-
California: 34 rounds, $59.10 M
-
Massachusetts: 7, $22.65 M
-
New York: 6, $15.50 M
-
Ohio: 4, $4.52 M
-
Illinois: 3, $4.45 M
Pre-Seed startup funding growth curves compared across top industries
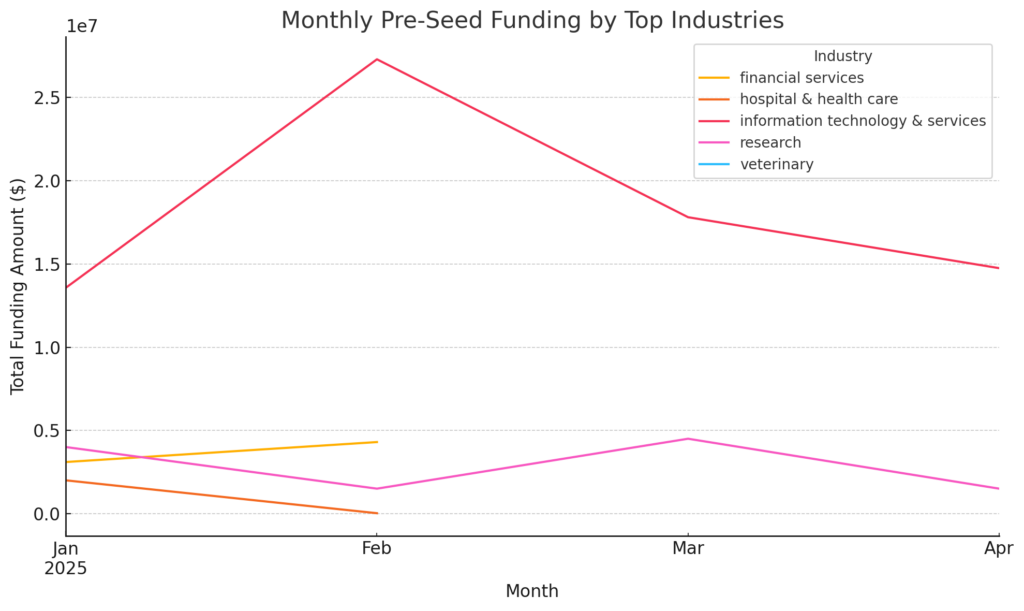
The growth curves for the top five pre-seed industries display distinct patterns:
-
Information Technology & Services (red line) surged from $13.5M in January to $27.5M in February, then tapered steadily through April.
-
Research (pink line) dipped in February before peaking at $4.5M in March and cooling off in April.
-
Financial Services (orange line) climbed gradually from $3.0M in January to $4.2M in April, reflecting consistent investor interest.
-
Veterinary (cyan line) appeared only in February to March with modest totals, indicating sporadic early bets.
-
Hospital & Health Care (brown line) declined from $2.0M in January to zero in February, then rebounded to $4.5M in March before dropping again.
Exceptionally Large and Small Pre-Seed Startup Funding Rounds
Exceptionally Large Pre-Seed Rounds (> $5.0 M):
-
Tandem (Veterinary) – $10 M on 2025-02-24
-
Pinkfish (IT & Services) – $7.6 M on 2025-02-11
-
Human (IT & Services) – $7.3 M on 2025-02-10
Exceptionally Small Pre-Seed Rounds (≤ $50 K):
-
PassCash (IT & Services) – $10 K on 2025-03-15
-
Nurse Lynx (Hospital & Health Care) – $25 K on 2025-02-13
-
Scooly (IT & Services) – $50 K on 2025-03-31
-
Concept Interactive (Entertainment) – $50 K on 2025-02-17
Key relationship insights for Pre-Seed funded startups
Deal Size vs. Industry
-
Veterinary commands the highest average pre-seed check at $10 M, driven by a single large round.
-
Defense & Space and Research follow with $3.25 M and $2.88 M average deals, respectively.
-
Mature “utility” sectors like IT & Services see more rounds but smaller checks (~$1.7 M average).
Deal Size vs. Geography
-
Massachusetts tops in per-deal size ($3.24 M avg) across 7 rounds.
-
New York and Washington trail with $2.58 M and $1.90 M average checks, respectively.
-
California leads in volume (34 rounds) with a $1.74 M average—ideal for high-velocity deal flow.
Industry–State Clusters for Pre-Seed Targeting
-
Information Technology & Services:
-
California (21 rounds, $1.71 M avg)
-
New York (5, $2.66 M avg)
-
Washington (2, $1.90 M avg)
-
-
Research:
-
California (2 rounds, $4.25 M avg)
-
Ohio & Pennsylvania (1 each, $1.50 M avg)
-
-
Veterinary:
-
Massachusetts (1 round, $10 M) – a standout large check in a niche vertical.
-
-
Financial Services:
-
California (2, $2.50 M avg), Ohio (1, $1.30 M), Indiana (1, $1.10 M)
-
-
Hospital & Health Care:
-
Massachusetts (2, $2.00 M avg) and Maryland (1, $25 K anomaly)
-
Strategic Takeaways
-
High-Value Opportunities: Niche sectors (Veterinary, Defense & Space) in Massachusetts and California.
-
Volume Plays: IT & Services in California and New York for a robust pipeline of modest-sized pre-seed rounds.
-
Emerging Pockets: Research in California, Ohio, and Pennsylvania offers above-average early checks.